Searching Dealership Inventories for the Best Priced Cars
The CIS Automotive API makes analyzing your automotive market on a vehicle by vehicle basis easy. In this example we'll show just how easy it is to look for used cars that a dealer has undervalued and present great buying opportunities for the consumer or arbitrage opportunities for other dealers.
In the end we're able to find the top 3% of deals with an average savings of $2,871.16 compared to similar vehicles.
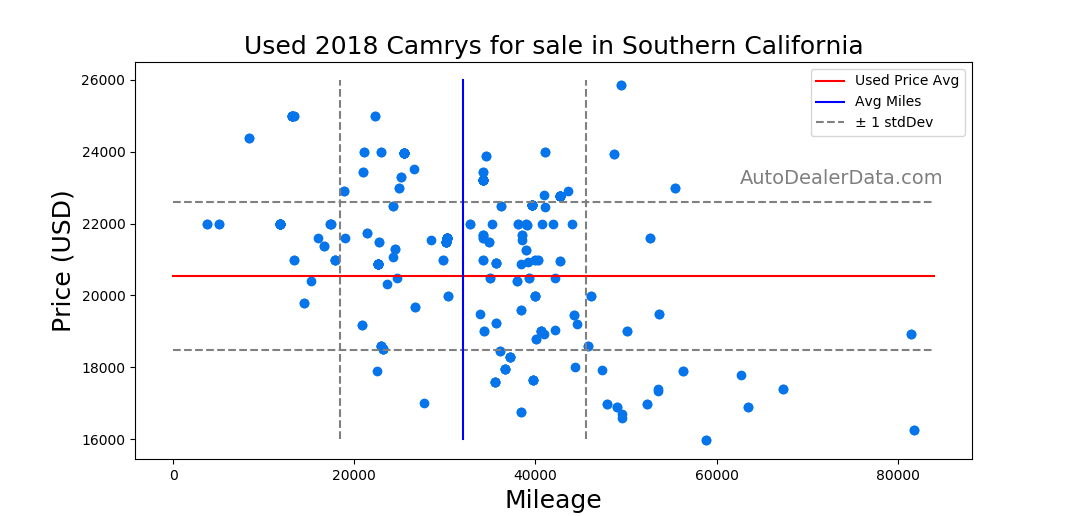
Here we can see the price and mileage distribution of used 2018 Camrys in dealer's inventories in Southern California. The red and blue lines denote the average price and average mileage respectively. The dotted gray lines indicate one standard deviation above and below the mean. We can see a general inverse correlation between price and mileage as you would expect. Most dealers have cars with around average mileage and accordingly price them around average. On the right side of the graph we can see that almost all of the high mileage vehicles have significantly lower prices than others, but there are also a few very optimistic dealers with high mileage Camrys.
It is clear in the bottom left portion of the graph that there are many vehicles with below average price and below average mileage. In a few cases we also see vehicles that are priced significantly below average while also having below average mileage. We'll be looking for Camrys like these because they potentially represent very good deals for the consumer, or for other dealerships who need to source cars for their own stores.
Defining our search and car value criteria
For now we'll just find used Camrys that are priced below average and have below average mileage in Southern California, but we could easilly find new or used cars of any model for sale all over the US by enumerating all regions supported by The CIS Automotive API.
We'll use the /listingsByRegion endpoint to search the car dealer's inventories in the region we care about. Alternatively, we could also get a list of dealers in Southern California from the /getDealersByRegion endpoint and use that list to pull individual dealer's inventories from the /listings endpoint to get more than one model at once.
Example Code
from cisapi import CisApi
api=CisApi()

regionName="REGION_SOUTHERN_CALIFORNIA"
modelName="Camry"
brandName="Toyota"
daysBack=5
res=api.listingsByRegion(regionName, modelName,
        page=1, newCars=False, daysBack=daysBack)
maxPages=res["data"]["maxPages"]
listings=res["data"]["listings"]

#We'll search all used Camry listings in Southern California
#from the last 5 days
for i in range(2, maxPages+1):
    res=api.listingsByRegion(regionName, modelName,
            page=i, newCars=False, daysBack=daysBack)
    listings=listings+res["data"]["listings"]
Checking market sales and price statistics
We'll now get the car market values from the /similarSalePrice endpoint and look through them for vehicles dealers have undervalued. We'll flag vehicles that are one or more standard deviations below the mean compared to similar vehicles and have below average mileage. We'll also flag vehicles that are priced below average with mileage less than one standard deviation below average.
We can save on some API calls by first grouping similar vehicles by VINs and using cached results when we come across a new vehicle similar to one we already saw.
Example Code
def vinToKey(vin):
    k=list(vin[:11]) #we don't need the serial number portion
    k[8]="*" #we don't need the checksum digit
    return "".join(k)

modelStats={}
lowCost=[]
lowMiles=[]
priceDelta=0
lowMilesPriceDelta=0
print("Getting similar vehicle stats")
for listing in listings:
    vin=listing["vin"]
    k=vinToKey(vin)
    if(not(k in modelStats)):
        res=api.similarSalePrice(vin, regionName, sameYear=True)
        modelStats[k]=res["data"]
        #do not need to pull stats for a vehicle similar
        #to one we've already pulled
    costAvg=modelStats[k]["usedSaleAvg"]
    costStdDev=modelStats[k]["usedSaleStdDev"]
    milesAvg=modelStats[k]["milesAvg"]
    milesStdDev=modelStats[k]["milesStdDev"]

    price=listing["askPrice"]
    miles=listing["mileage"]
    if(price>0 and miles>0):
        if(price<(costAvg-costStdDev) and miles<(milesAvg)):
            lowCost.append(listing)
            priceDelta+=costAvg-price
        if(costAvg>price and (milesAvg-milesStdDev)>miles):
            lowMiles.append(listing)
            lowMilesPriceDelta+=costAvg-price

print("Pulled data on : "+str(len(listings))+" vehicles.")
print("Discovered "+str(len(lowCost))+" undervalued "+modelName+" in "+regionName)
print("Discovered "+str(len(lowMiles))+" undervalued low mileage "+modelName+" in "+regionName)
if(len(lowCost)>0):
    print("Average low price undervaluation: "+"${:,.2f}".format(
            priceDelta/len(lowCost)))
    print("Total undervaluation: "+"${:,.2f}".format(priceDelta))
if(len(lowMiles)>0):
    print("Average low miles undervaluation: "+"${:,.2f}".format(
            lowMilesPriceDelta/len(lowMiles)))
    print("Total undervaluation: "+"${:,.2f}".format(lowMilesPriceDelta))
Output
Pulled data on : 3420 vehicles.
Discovered 100 undervalued Camry in REGION_SOUTHERN_CALIFORNIA
Discovered 27 undervalued low mileage Camry in REGION_SOUTHERN_CALIFORNIA
Average low price undervaluation: $2,871.16
Total undervaluation: $287,115.55
Average low miles undervaluation: $891.08
Total undervaluation: $24,059.27
Conclusion
The 100 Camrys we flagged represent about 3% of the vehicles we looked at across all model years with available mileage and pricing data. If we look back at the graph above we can even see a few of the 2018s that were flagged in the bottom left. The average savings of $2,871.16 is quite high and presents a good opportunity for retail buyers or dealers who need to find inventory they can turn a profit on. Car transportation costs can be high, but there is a lot of room in the discounts we found to cover moving the cars long distances.
We can easily modify the above script to pull data for another model like Honda's Accord, Ford's F-150, or change it to get data for another region like Florida. Below we show a slightly modified script that moves most of the logic into a self contained function to simplify these parameter changes.
from cisapi import CisApi
api=CisApi()

def vinToKey(vin):
    k=list(vin[:11]) #we don't need the serial number portion
    k[8]="*" #we don't need the checksum digit
    return "".join(k)

def findUnderpricedVehicles(regionName="REGION_SOUTHERN_CALIFORNIA", modelName="Camry", brandName="Toyota", daysBack=5, newCars=False):
    res=api.listingsByRegion(regionName, modelName,
            page=1, newCars=False, daysBack=daysBack)
    maxPages=res["data"]["maxPages"]
    listings=res["data"]["listings"]

    #We'll search all used Camry listings in Southern California
    #from the last 5 days
    for i in range(2, maxPages+1):
        res=api.listingsByRegion(regionName, modelName,
                page=i, newCars=newCars, daysBack=daysBack)
        listings=listings+res["data"]["listings"]

    modelStats={}
    lowCost=[]
    lowMiles=[]
    priceDelta=0
    lowMilesPriceDelta=0
    print("Getting similar vehicle stats")
    for listing in listings:
        vin=listing["vin"]
        k=vinToKey(vin)
        if(not(k in modelStats)):
            res=api.similarSalePrice(vin, regionName, sameYear=True)
            modelStats[k]=res["data"]
            #do not need to pull stats for a vehicle similar
            #to one we've already pulled
        costAvg=modelStats[k]["usedSaleAvg"]
        costStdDev=modelStats[k]["usedSaleStdDev"]
        milesAvg=modelStats[k]["milesAvg"]
        milesStdDev=modelStats[k]["milesStdDev"]

        price=listing["askPrice"]
        miles=listing["mileage"]
        if(price>0 and miles>0):
            if(price<(costAvg-costStdDev) and miles<(milesAvg)):
                lowCost.append(listing)
                priceDelta+=costAvg-price
            if(costAvg>price and (milesAvg-milesStdDev)>miles):
                lowMiles.append(listing)
                lowMilesPriceDelta+=costAvg-price

    print("Pulled data on : "+str(len(listings))+" vehicles.")
    print("Discovered "+str(len(lowCost))+" undervalued "+modelName+" in "+regionName)
    print("Discovered "+str(len(lowMiles))+" undervalued low mileage "+modelName+" in "+regionName)
    if(len(lowCost)>0):
        print("Average low price undervaluation: "+"${:,.2f}".format(
                priceDelta/len(lowCost)))
        print("Total undervaluation: "+"${:,.2f}".format(priceDelta))
    if(len(lowMiles)>0):
        print("Average low miles undervaluation: "+"${:,.2f}".format(
                lowMilesPriceDelta/len(lowMiles)))
        print("Total undervaluation: "+"${:,.2f}".format(lowMilesPriceDelta))

    #you'll probably want to return some of the data here

modelNames=api.getModels("Toyota")["data"]
regionName="REGION_SOUTHERN_CALIFORNIA"
for m in modelNames:
    modelName=m["modelName"]
    print("Beginning search for underpriced "+modelName+" in "+regionName)
    findUnderpricedVehicles(regionName=regionName, modelName=modelName)