Analyzing Competing Dealerships
This post shows how to use CIS Automotive API to compare sales data among dealerships.
Market wide averages may be a convenient way to benchmark your dealership, but a lot of granularity is lost with that abstraction. Different markets can value various features very differently and an average over a large geographic area may not show important differences.
The CIS Automotive API makes it easy to discover and recover those details and benchmark yourself against direct competeters. We'll take a look at several different dealerships and calculate various statistics for each that we can compare against other dealerships and regional averages.
Pulling the listing data
We'll use the /listingsByDate endpoint in combination with a few other endpoints to search historical snapshots of select car dealer's inventories in Southern California. With this endpoint, we can pull from our vehicle database as far back as 2016 or from another region. For this example, we'll look at new inventory in January 2021.
We're going to look at various dealerships in sequence, so a single thread for requests will work fine, but we could speed it up with multithreading. We have a multithreaded request example here, where we looked at Electric Vehicle propagation.
Users on an enterprise plan can get a vehicle datadump that would speed up our analysis even more. This particular use case would benefit from running queries against a sql database as we scale our analysis to cover the entire state, but is still easy to run against our API on this example's scale.
Example Code
from cisapi import CisApi
from datetime import date, timedelta
import pandas as pd

api=CisApi()

dealerID=53
startDate="2021-01-01"
endDate="2021-02-01"

dealerInfo=api.getDealersByID(dealerID)["data"][0]
dealerName=dealerInfo["dealerName"]
zipCode=dealerInfo["zipCode"]

listings=[]
page=1
while(True):
    res=api.listingsByDate(dealerID, startDate, endDate, page=page, newCars=True)
    resListings=res["data"]["listings"]
    for r in resListings:
        firstSeen=date.fromisoformat(r["firstSeen"])
        lastSeen=date.fromisoformat(r["lastSeen"])
        delta=(lastSeen-firstSeen).days+1
        r["delta"]=delta
    listings+=resListings
    if(page>=res["data"]["maxPages"]):
        break
    page=page+1

df=pd.DataFrame(listings)
print(df.loc[:, ["modelName", "delta"]].groupby(["modelName"]).describe())
Here we're concerned with the days to sell metric, which measures how long a vehicle is in the dealer's inventory. In general a lower value for days to sell is more desireable because a dealer can more quickly reinvest the profit on each sale back into their business. Dealers with more than a few vehicles also generally finance their inventory using a line of credit called a floorplan. If they can sell vehicles faster they will pay less interest on that line of credit leaving more room for profit.
We'll run the above code for several dealers in Southern California and get output similar to the following. We use the data to populate the charts and graphs on this page.
              delta
              count        mean        std    min     25%    50%     75%    max
modelName
4-RUNNER       20.0   21.300000  18.081977    3.0   10.75   18.0   22.25   81.0
86              1.0   22.000000        NaN   22.0   22.00   22.0   22.00   22.0
AVALON         12.0   95.333333  59.532013    1.0   49.75   96.0  130.25  191.0
C-HR            4.0   26.750000  12.816006   15.0   21.00   23.5   29.25   45.0
CAMRY         107.0   62.280374  41.514897   10.0   29.00   51.0   84.50  193.0
COROLLA        64.0   53.453125  38.730624    3.0   22.00   41.0   90.75  142.0
HIGHLANDER     48.0   58.583333  41.873586    1.0   24.75   50.5   78.25  213.0
LAND CRUISER    2.0   39.500000  33.234019   16.0   27.75   39.5   51.25   63.0
PRIUS          22.0  138.545455  69.740831    1.0   95.75  141.0  175.75  254.0
PRIUS PRIME    42.0   50.047619  40.645974    2.0   20.25   36.5   65.00  178.0
RAV4           68.0   28.411765  20.748124    1.0   15.75   24.5   37.00  115.0
RAV4 PRIME      2.0    8.000000   2.828427    6.0    7.00    8.0    9.00   10.0
SEQUOIA         1.0   13.000000        NaN   13.0   13.00   13.0   13.00   13.0
SIENNA         21.0   21.904762  17.102353    1.0   11.00   16.0   24.00   73.0
TACOMA         32.0   24.843750  21.302899    2.0    7.75   22.0   32.00   83.0
TUNDRA          2.0   34.500000  27.577164   15.0   24.75   34.5   44.25   54.0
VENZA           3.0   23.666667  10.016653   14.0   18.50   23.0   28.50   34.0
Analysis
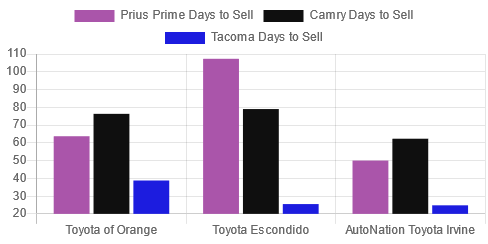
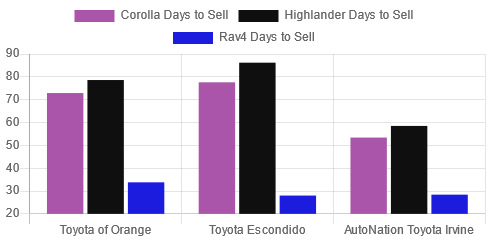
Now that we've pulled the inventory data from our automotive API we can run some analysis on it. It's clear the Rav4 sells quickly at each dealership, but AutoNation typically has a much faster turn around than the other two dealers. A common turn around goal for dealers is to sell a vehicle before it's been on the lot for over 60 or 90 days. When looking at the extended stats from our dataframe for AutoNation, it's clear they meet this goal for the vast majority of new vehicles that pass through their dealership.
Toyota of Orange and Toyota Escondido met a 60 or 90 day turn around less often. For Corollas, Toyota Escondido had 25% of their inventory take 109 days or more to sell with at least one vehicle staying on the lot for 241 days. Toyota of Orange had a similar 105+ days to sell for 25% of their Corolla inventory over the same time period.
We can see a sharp difference between all three dealers when it comes to selling Prius Primes. AutoNation is still the fastest on average, but Toyota of Orange is close compared to Toyota Escondido. Escondido had 25% of their Prius Primes sell in 61 days or less, but when we look at 75% it jumps up to 127 days. For perspective, AutoNation managed to sell 75% of their Prius Primes in 65 days or less; about twice as fast. Toyota of Orange sold 50% in 57 days or less and 75% in 86 days or less.
This is a pretty big discrepancy between the three dealers, so let's dig in a bit and look at the pricing for the Prius Prime at each dealer. We can run another one line dataframe operation to get some stats on the price.
print(df.loc[df["modelName"]=="PRIUS PRIME", ["modelName", "askPrice"]].groupby(["modelName"]).describe())
#Orange
                           count                 mean                  std                  min                  25%                  50%                  75%                  max
PRIUS PRIME                63.00            30,628.52             2,227.10            25,899.00            29,479.00            31,222.00            31,439.00            35,947.00
#Escondido
                           count                 mean                  std                  min                  25%                  50%                  75%                  max
PRIUS PRIME                25.00            28,540.96             2,085.65            25,478.00            26,833.00            28,333.00            30,333.00            32,243.00
#AutoNation
                           count                 mean                  std                  min                  25%                  50%                  75%                  max
PRIUS PRIME                42.00            28,017.24             2,275.40            24,519.00            26,501.75            27,541.00            30,004.25            31,757.00
We can see from the average prices that AutoNation generally lists their Prius Primes for less than the other two dealers, and favors lower priced vehicles in general. The maximum price at AutoNation roughly corresponds to the 75th percentile for price at Toyota of Orange and is $500 lower than Toyota Escondido. The 25th and 75th price percentiles at AutoNation and Toyota Escondido are close to each other, but AutoNation is still cheaper at each quartile boundry.
When we look back at the days to sell values for AutoNation and Toyota of Orange for the Prius Prime, the 13 day average difference seems to make consumer's price sensitivity clear. AutoNation manages to sell Prius Primes 26% faster while charging only 8.52% less than Toyota of Orange.
Toyota of Escondido seems to be charging a good price for their Prius Primes if we compare it to AutoNation, but they have a very large average days to sell for that model at 107 days. When we look at the other new vehicles Escondido had in stock it becomes clear that Prius Primes just aren't popular in their area. The dealer stocked only 25 of them in the month we looked at, but they did stock 123 Camries, 103 Corollas, 66 Highlanders, 60 Rav4s, and 59 Tacomas amongst some other models in the same timeframe. Each model had a significantly better average days to sell value with Tacomas winning at an average 25.5 days.
Conclusion
We can perform similar inventory and sales analysis on arbitrary dealerships going back to early 2016, by pulling from our database of over 725 million vehicles. When we look at the automotive market at scale we can find a lot of interesting results.
If you'd like to extend our demo code to perform analysis on other dealers and brands, you can sign up here. A larger scale analysis of every dealer in California for example, really benefits from a datadump, so feel free to contact us about our enterprise options.
from cisapi import CisApi
from datetime import date, timedelta
import pandas as pd

api=CisApi()

dealerID=53
startDate="2021-01-01"
endDate="2021-02-01"

dealerInfo=api.getDealersByID(dealerID)["data"][0]
dealerName=dealerInfo["dealerName"]
zipCode=dealerInfo["zipCode"]

listings=[]
page=1
while(True):
    res=api.listingsByDate(dealerID, startDate, endDate, page=page, newCars=True)
    resListings=res["data"]["listings"]
    for r in resListings:
        firstSeen=date.fromisoformat(r["firstSeen"])
        lastSeen=date.fromisoformat(r["lastSeen"])
        delta=(lastSeen-firstSeen).days+1
        r["delta"]=delta
    listings+=resListings
    if(page>=res["data"]["maxPages"]):
        break
    page=page+1

df=pd.DataFrame(listings)
print(df.loc[:, ["modelName", "delta"]].groupby(["modelName"]).describe())
              delta
              count        mean        std    min     25%    50%     75%    max
modelName
4-RUNNER       20.0   21.300000  18.081977    3.0   10.75   18.0   22.25   81.0
86              1.0   22.000000        NaN   22.0   22.00   22.0   22.00   22.0
AVALON         12.0   95.333333  59.532013    1.0   49.75   96.0  130.25  191.0
C-HR            4.0   26.750000  12.816006   15.0   21.00   23.5   29.25   45.0
CAMRY         107.0   62.280374  41.514897   10.0   29.00   51.0   84.50  193.0
COROLLA        64.0   53.453125  38.730624    3.0   22.00   41.0   90.75  142.0
HIGHLANDER     48.0   58.583333  41.873586    1.0   24.75   50.5   78.25  213.0
LAND CRUISER    2.0   39.500000  33.234019   16.0   27.75   39.5   51.25   63.0
PRIUS          22.0  138.545455  69.740831    1.0   95.75  141.0  175.75  254.0
PRIUS PRIME    42.0   50.047619  40.645974    2.0   20.25   36.5   65.00  178.0
RAV4           68.0   28.411765  20.748124    1.0   15.75   24.5   37.00  115.0
RAV4 PRIME      2.0    8.000000   2.828427    6.0    7.00    8.0    9.00   10.0
SEQUOIA         1.0   13.000000        NaN   13.0   13.00   13.0   13.00   13.0
SIENNA         21.0   21.904762  17.102353    1.0   11.00   16.0   24.00   73.0
TACOMA         32.0   24.843750  21.302899    2.0    7.75   22.0   32.00   83.0
TUNDRA          2.0   34.500000  27.577164   15.0   24.75   34.5   44.25   54.0
VENZA           3.0   23.666667  10.016653   14.0   18.50   23.0   28.50   34.0